There may be times when students are in touch to say that their experience when taking an online quiz in eClass wasn't as they had expected, for example, their internet connection timed out during the quiz, or they were having access issues and weren't able to get to the quiz, or their time ran out etc . When these situations come up, it's helpful to be able to look at the quiz reports available to you so you can determine the best method to assist the student with their concern.
How to access quiz reports
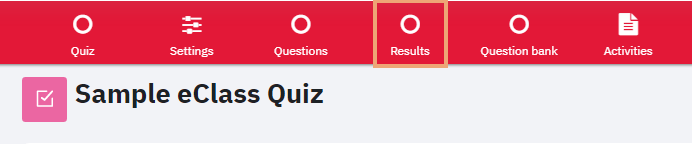
From within your quiz click on the Results icon in the top menu bar,
Grades report
From the top of the Results page, click on the drop down menu and choose the Grades option,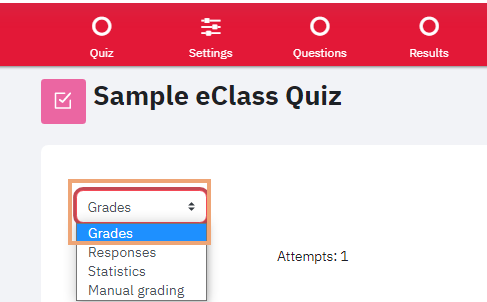
This report will show you all of the students attempts, when they started the quiz, when they ended the quiz, how long they took to take the quiz and which of their questions were marked correct or incorrect,
- There is a link to Review attempt under each students name so you can have a more detailed view of when they answered each question,
- You can also select and Regrade attempts by clicking the Regrade attempts… button,
- From here you can also reset any attempt for students, by placing a checkmark next to the students name and using the Delete Selected Attempts button,

Using the filters at the top of the page you can further fine tune which users you'd like to see, for example, those who haven't attempted the quiz at all or any attempts that have not been submitted.

Responses report
From the top of the Results page, click on the drop down menu and choose the Responses option.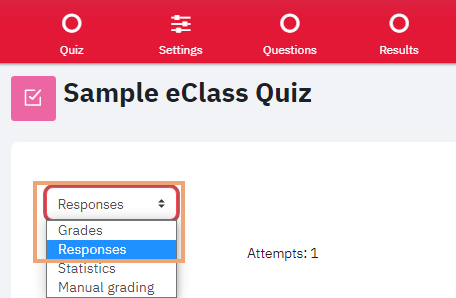
The responses report is very similar to the grades report except it will show you the answers that each student provided for each question.

Statistics report
From the top of the Results page, click on the drop down menu and choose the Statistics option.
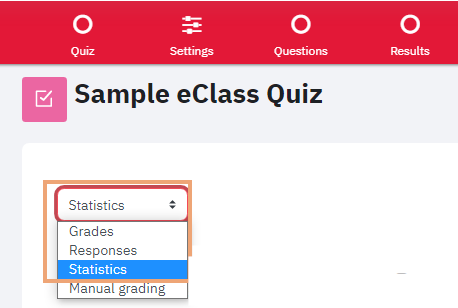
The statistics report gives you a statistical analysis of the quiz and questions and some useful insights into how students are responding to questions, whether questions are broken or if random variants are fair. A detailed explanation of this report can be found here.
Manual grading report
From the top of the Results page, click on the drop down menu and choose the Manual grading option.
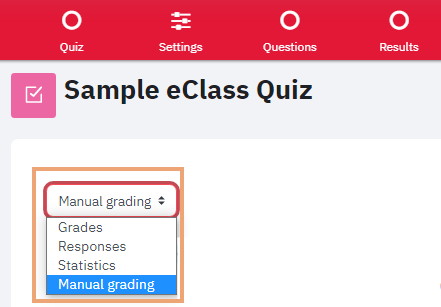
Some questions, like multiple choice, are graded automatically, others require an element of manual grading. This report gives you easy access to a view of questions that need to be manually graded or have already been graded.
Your course logs can help too
Your course logs might also give you some information about issues students may have encountered. Consider, for example, that a student went into the wrong quiz or being able to see that a student navigated out of your course when they were taking the quiz. Looking through your course logs can help you try to understand what could have happened.